Remote Debugging for Mobile coming next release!
Smart GWT 5.0 and SmartClient 10.0 have a lot of exciting upgrades for mobile applications, including a new Remote Debugging feature for the Developer Console.
While the Developer Console already works on mobile devices, it currently appears as a separate tab or browser window, and phone-sized devices don’t have the screen space necessary to use tools like the Watch Tab.
Remote Debugging allows you to run the Developer Console on your desktop machine to debug a page running on a mobile device. With Remote Debugging, you can use all of the powerful debugging features of the Developer Console – the component hierarchy (Watch tab), client/server requests (RPC tab), logs and log categories – using the large screen and physical keyboard of a desktop machine.
Using Remote Debugging
We’ve made remote debugging as simple to use as possible. Just add isc_remoteDebug=true to the URL when accessing a page on a mobile device. For example, if you have the SmartClient SDK installed, you can go to the Feature Explorer like so:
Please note that in the URL above, set the localhost to the actual hostname or IP address of the machine running the SDK.
Then open the Developer Console in your desktop browser. You can do this from any page on the same server, or you can go directly to the Developer Console:
- http://localhost:8080/isomorphic/system/helpers/Log.html [for SmartClient]
- [myProject]/sc/system/helpers/Log.html [for Smart GWT]
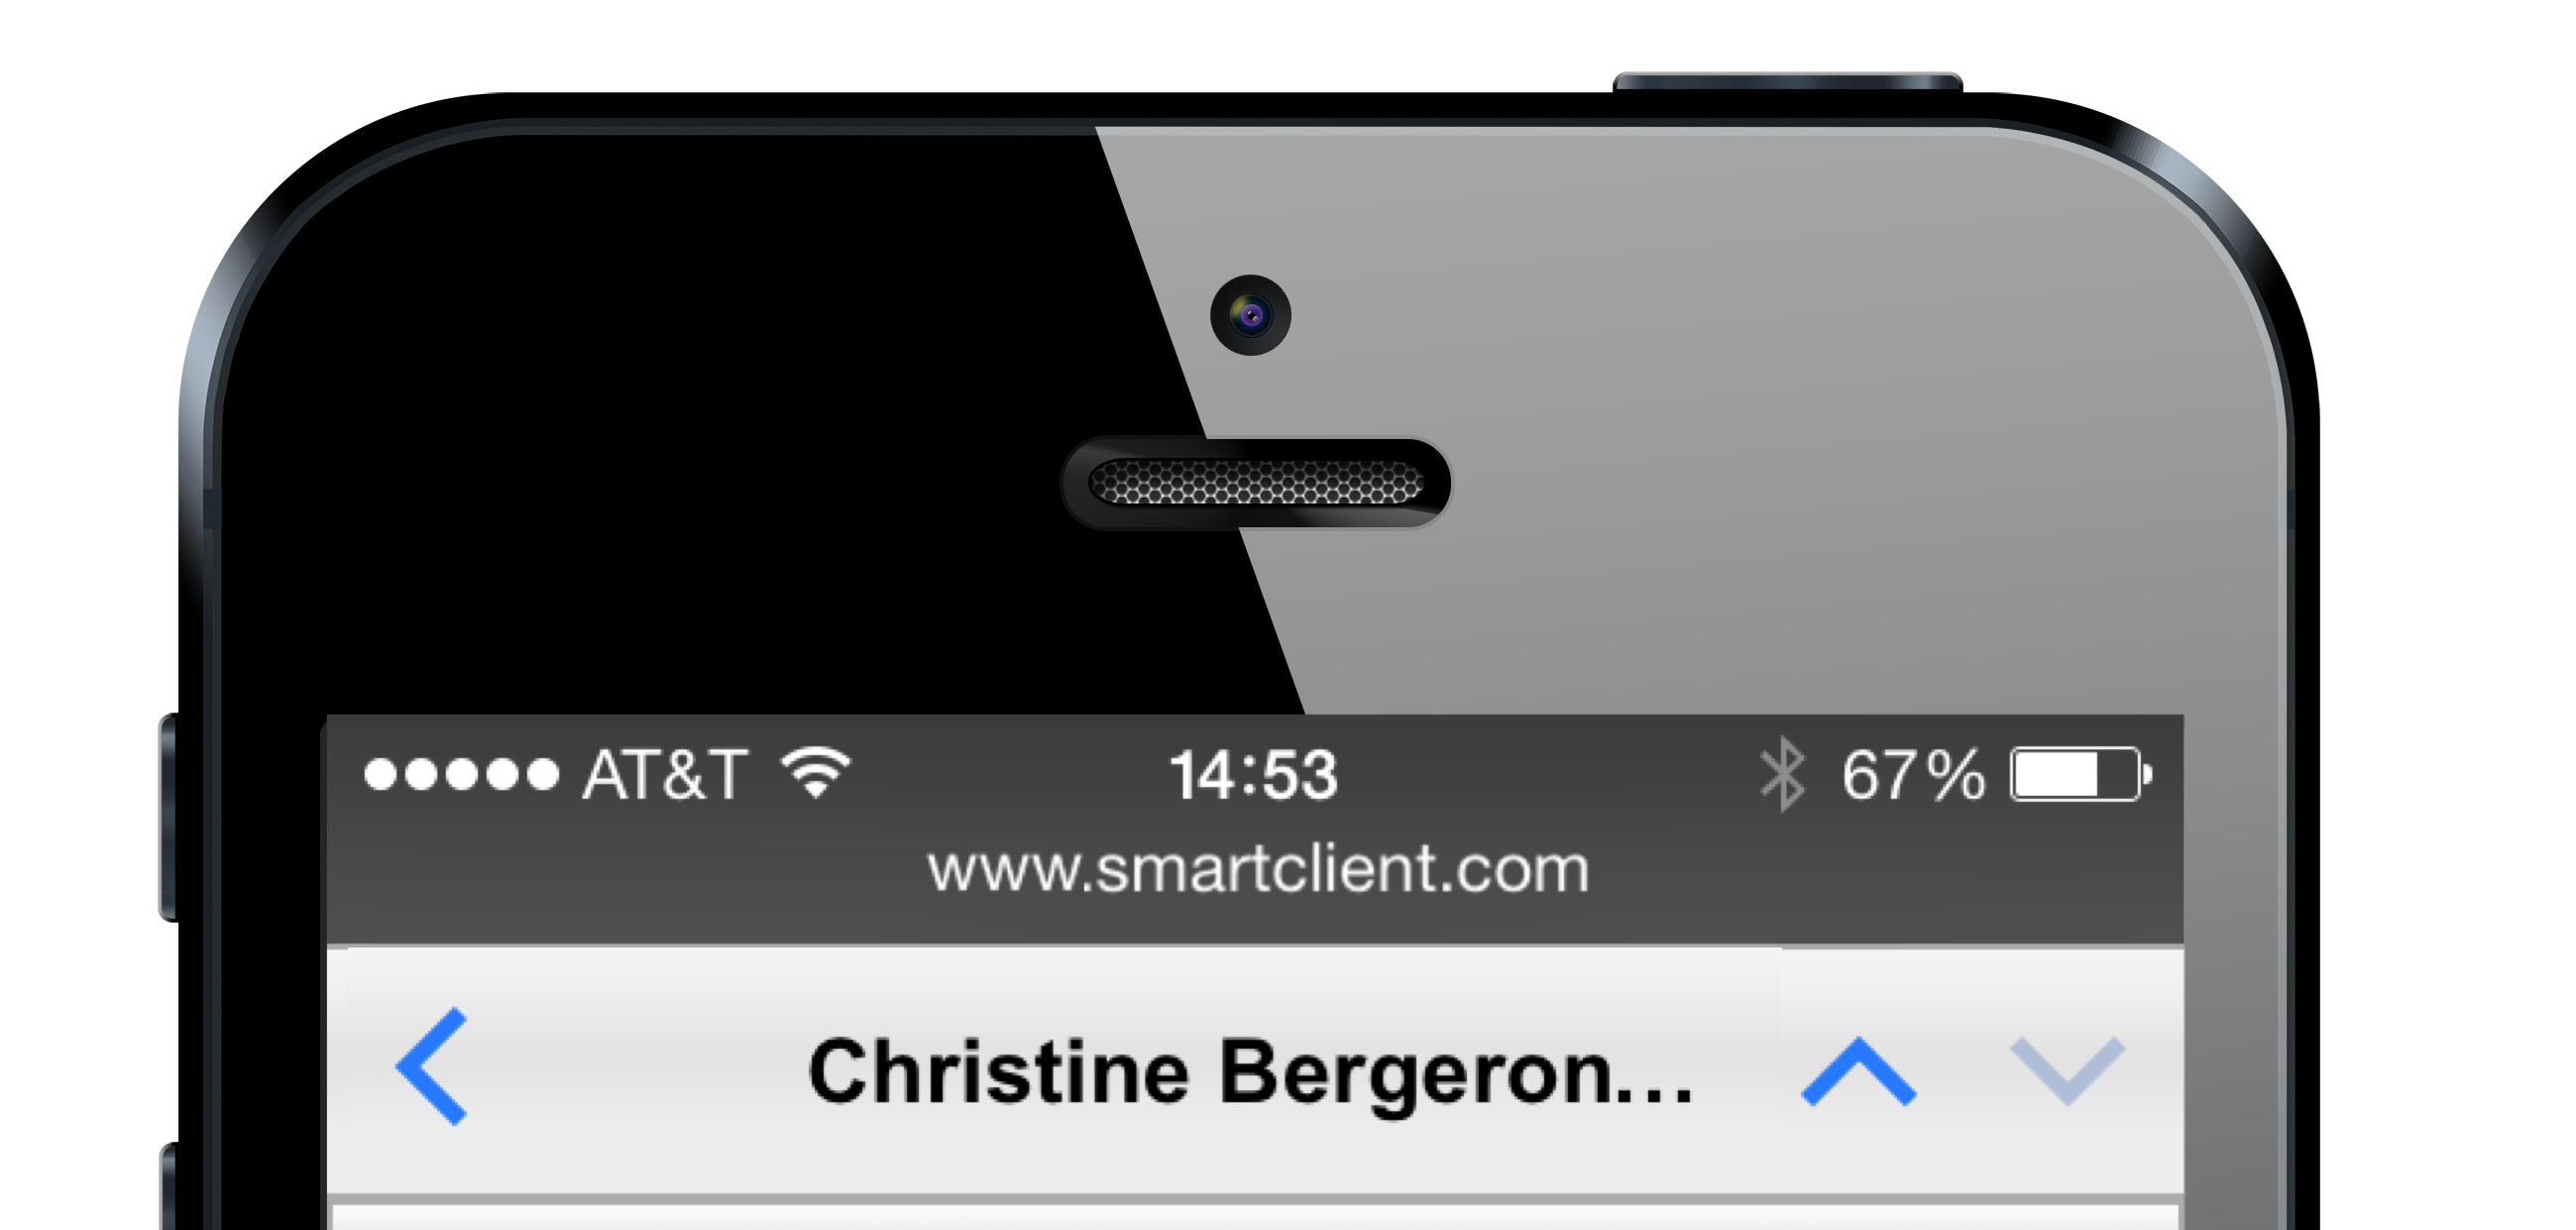
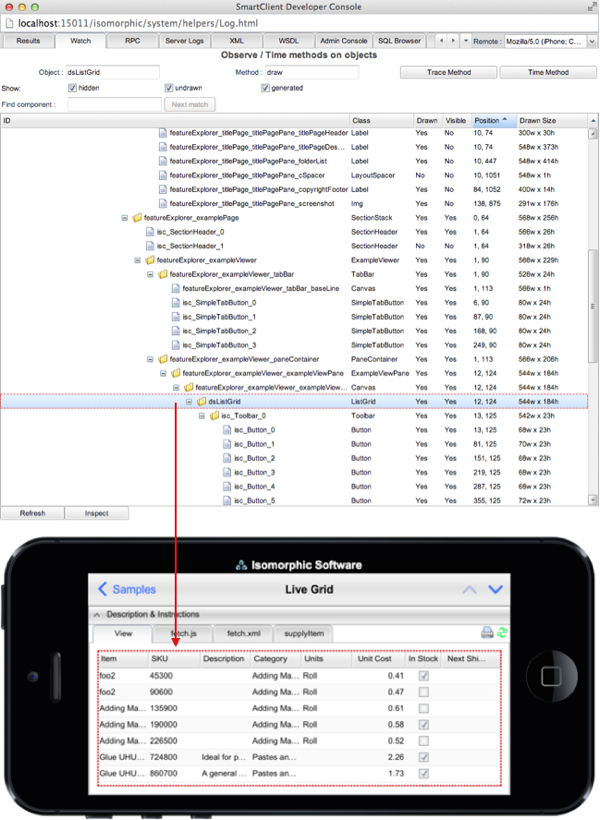
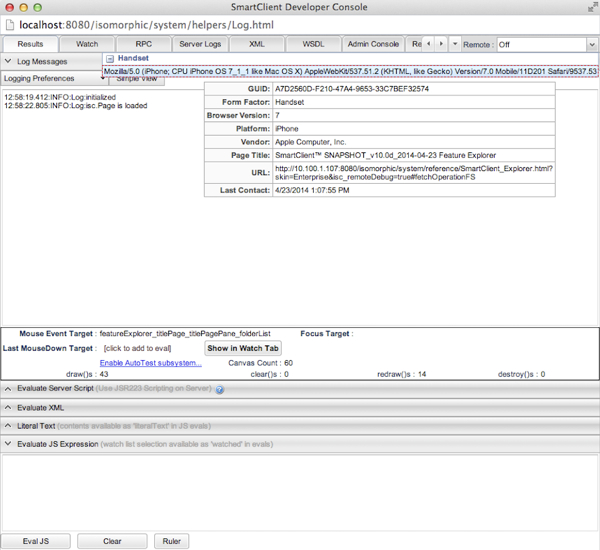
You will see a “Remote” drop-down that lists the devices and URLs that have registered for remote debugging (by passing the isc_remoteDebug parameter). As you roll over the available remote targets in this drop-down, the target page will glow blue to make it easy to tell which page you will be selecting for debugging – this is particularly handy when you have a lot of devices. In this screenshot you can see what it would look like for an iPhone viewing the SmartClient Feature Explorer:
Pick the page to debug and just starting using the Developer Console as normal – that’s it!
If you reload the page on your mobile device, the remote Developer Console automatically re-establishes the connection. And any settings – such as Logging Preferences or Watch tab settings – automatically persist as they normally would.
Who can use Remote Debugging?
Anyone with a Pro Edition or above license will have access to the Remote Debugging feature in the next release.
Under the covers, the Remote Debugging feature actually uses the Real-time Messaging module, which is not a Pro Edition feature. However, we’ve rearranged things so that Pro Edition users can use Real-time Messaging just for Remote Debugging.
This does mean that if you are upgrading your environment to Smart GWT 5.0 / SmartClient 10.0 and you don’t already have Real-time Messaging, you will need to follow the installation steps normally required for Real-time Messaging before the Remote Debugging feature will work. See the “Optional Modules” documentation in your SDK for details.
Download Smart GWT 5.0d or SmartClient 10.0d to get started using our newest features today!
Enjoy!
The Isomorphic Team