Just landed: User-defined data highlighting
Just landed in nightly builds for both SmartClient and Smart GWT: user-defined data highlighting.
A very common requirement in enterprise applications is highlighting important or unusual data values, that is, coloring them an eye-catching color, or coloring different ranges of values different colors.
However, in all but the most trivial applications, the rules for what should be highlighted are highly dynamic and context specific – you can’t just hardcode what is considered a high or low value when your application is portfolio management or threat analysis.
The ideal solution is to:
- enable users to define their own highlighting rules on the fly
- enable users to save and share highlighting rules
This is what the new data highlighting system does.  We’ve made it extremely simple – calling editHilites() provides a complete, pre-configured editing interface for hilites, starting with this screen:

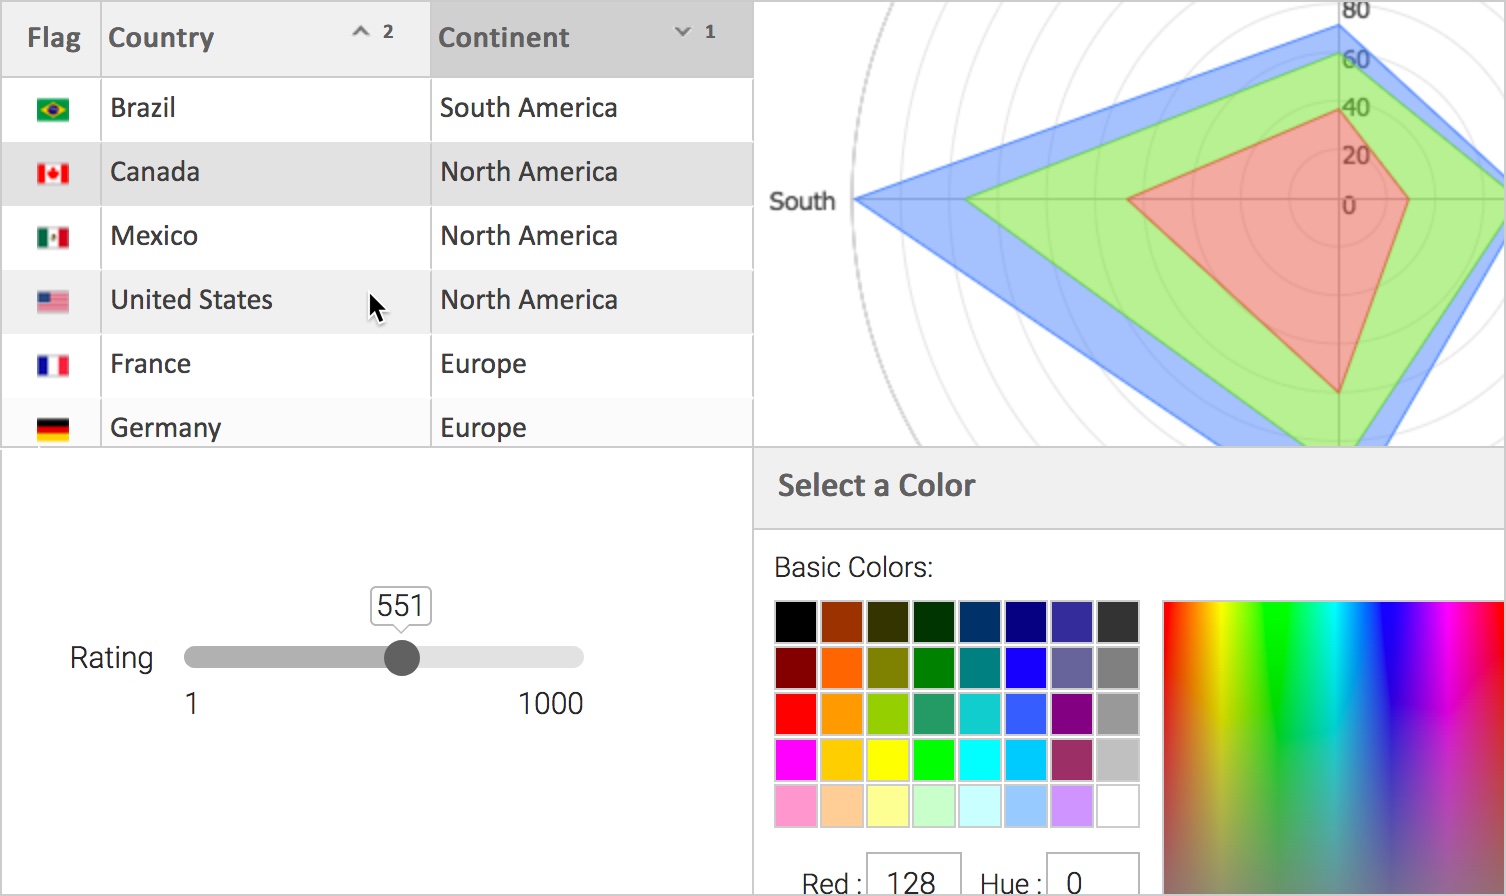
This dataset involves countries of the world. On the left, you have all the available fields that you can use to define highlighting rules – clicking on a field name adds a line to the right where you can pick an operator, a value, and a color to show. With a few clicks, you could set up ranged highlighting to emphasize high GDP countries:

After hitting save to return to the grid, it looks like this:

Let’s say we wanted to do something more advanced – the “Add Advanced Rule” button leads to an interface where you can define truly arbitrary criteria on multiple fields. In the screenshot below, we’re picking out countries with either a population over 1 Billion, or less than 5 Million square kilometers with a population over 100 million.

When we press “Save” in this dialog, we see all of our rules together. A prose description is automatically generated for our complex filter criteria.

Finally, here’s what the grid looks like once we’ve saved these rules. China and India qualify with their over 1 Billion populations; nations over 100 million with relatively smaller area include Indonesia, Japan and Mexico.

We got all of this behavior just by calling editHilites(). This works with any grid and any DataSource. The criteria are applied client-side, so there’s no server-side code necessary to support this. And this entire system also works with loading data on demand with no additional configuration – the highlights are simply applied to the data as it’s retrieved.
You can even highlight user-created formula fields – for example, you can create a GDP per capita field for the above dataset by dividing GDP by population, then highlight high and low values.
Highlights are also easy to persist and restore. ListGrid.getHiliteState() gives you a String that contains the highlight rules in serialized form; just save this to a database column or similar, and you can re-apply it via ListGrid.setHiliteState() later.
To take a deeper look at the new highlighting system, see the samples under Grids -> Hiliting in the Showcase.
